
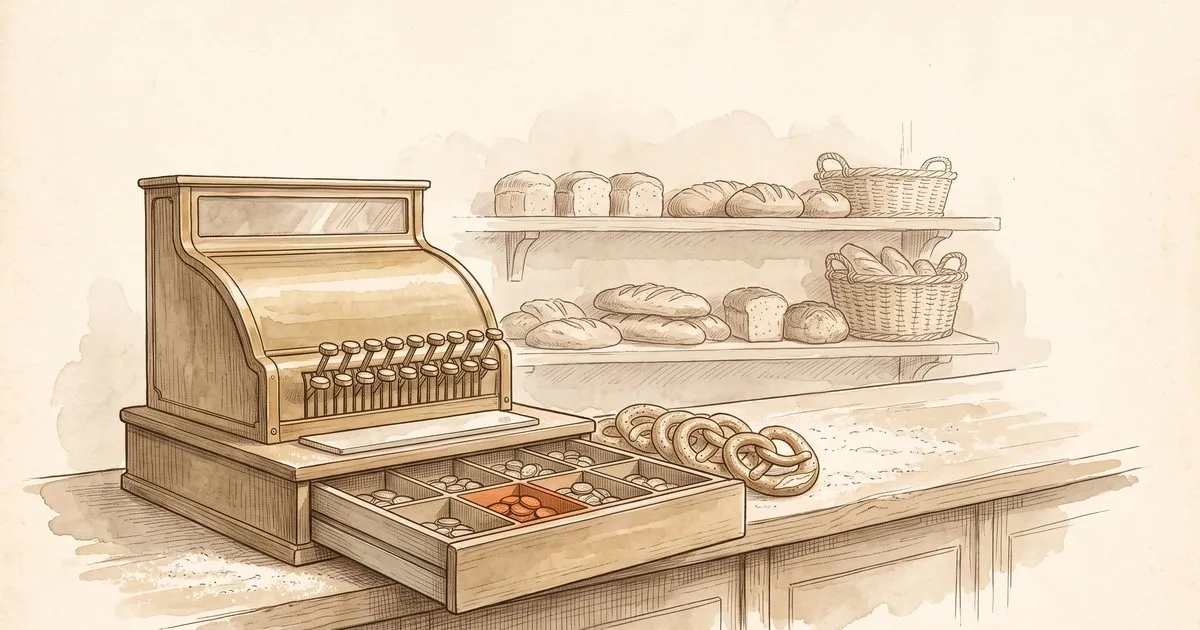
Picture a bakery a few streets away. Solid business, good pretzels, and at the end of the year seven cents of every euro in revenue are left over. Seven per cent margin, completely normal for plenty of industries, from mechanical engineering to retail.
Now three things happen that, taken individually, are almost boring. The bakery learns from its sales data when which products run out, and sells five per cent more, because at four in the afternoon the shelf is still full. It plans its baking quantities better and throws away ten per cent less. And because orders no longer run on scribbled notes and shouting across the room, the same team gets five per cent more done in the same time.
Two of those are the same move. Plan properly and you have full shelves in the evening and still less in the bin. No contradiction: that is the difference between baking less and baking right.
No new product. No price increase. Not a single spectacular moment — and yet profit at the end of the year has more than tripled.
Sounds like a magic trick? It is not. It is arithmetic, and precisely the arithmetic behind the rather bold question in the title. Let us work through it.
The maths: three small numbers, one large effect
Take a company with 100 million euros in revenue and 93 million in costs. That leaves 7 million in profit, so a 7 per cent margin. Now apply the three levers from the bakery, translated into corporate language: revenue up 5 per cent. Productivity up 5 per cent. Costs down 10 per cent. Round numbers, chosen deliberately and not a benchmark: they are there to show the mechanics, not to pre-empt your result.
Revenue rises to 105 million.
Costs drop by ten per cent to around 84 million. And because the same organisation delivers five per cent more per hour worked, they slide further towards 80 million.
That leaves a good 25 million in profit on 105 million in revenue. Depending on how you combine the effects, you land at a good 24 per cent margin. Seven per cent becomes twenty-four. Tripled would be twenty-one.
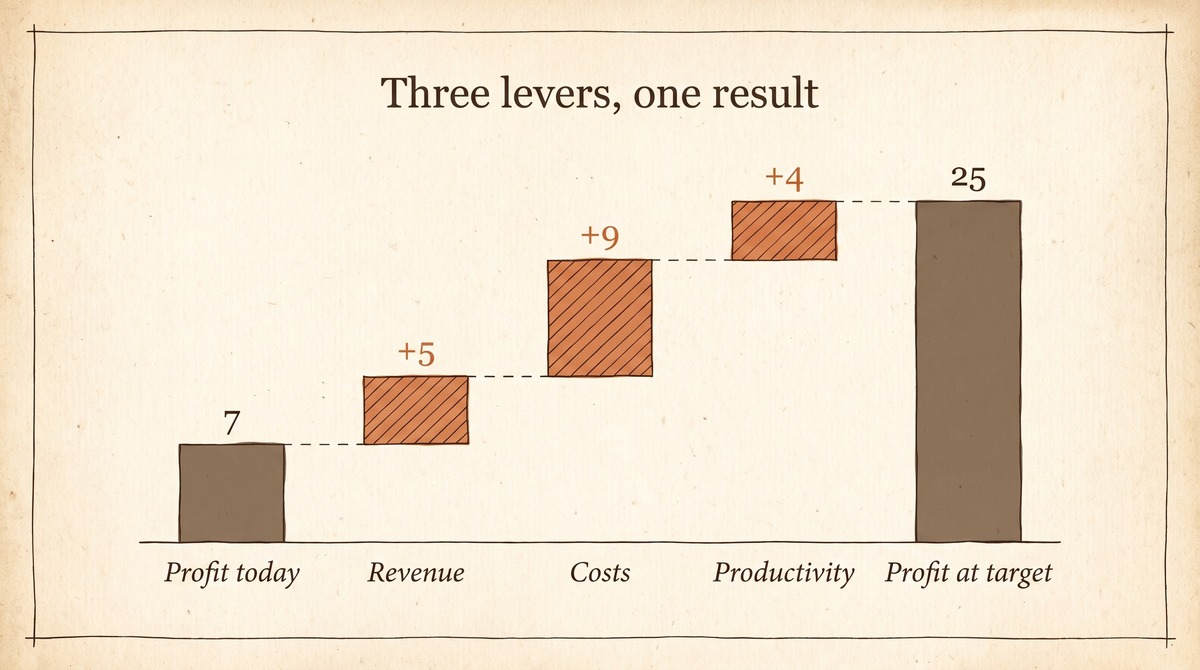
The margin is a narrow rim, and narrow rims react enormously to small shifts at either end. At a 7 per cent margin, a single percentage point off your costs is a seventh more profit. Five per cent more revenue, most of which flows through, is not “five per cent growth”, it is a jump in profit. Three unspectacular numbers, multiplied rather than added.
You do not even need all three. Ten per cent off your costs alone, without a single euro of extra revenue, turns 7 million in profit into 16. The most boring of the three levers doubles the margin on its own.
So the answer to the question in the title is not “nonsense, consultant fantasy”. The arithmetic itself is sound. The interesting question is where the three numbers come from.
Where the percentages come from and what data and AI have to do with it
This is where data and AI strategy enters. Not as a document. As the work that makes the three levers reachable in the first place.
Revenue up 5 per cent rarely comes from more sales pressure. It comes from better decisions: spotting which customers are about to leave before they are gone, because a model sees that pattern weeks before the cancellation letter. Adjusting prices when the market allows it, not a quarter later. Knowing which product is selling in which region instead of guessing. That is the empty pretzel tray at four in the afternoon, just at B2B scale.
Productivity up 5 per cent is the territory of automation and, increasingly, of agentic AI. That is, systems that take over entire process steps within defined guardrails: checking documents, reconciling orders, pre-qualifying enquiries, triggering follow-up steps. Generating an answer is the smallest part of it. Five per cent sounds modest, but spread it across a thousand people who spend every day searching for, transferring and retyping information. Suddenly five per cent is conservative.
Costs down 10 per cent comes from the engine room: inventory that matches real demand rather than anxiety reserves. Scrap that gets noticed before the batch runs through. Supply chains that see bottlenecks coming. All three are forecasting problems at heart, which makes them AI territory as soon as the data foundation holds. The bakery’s waste bin, just with considerably more zeros.
Notice the pattern? None of these levers is a technology project. They are business problems where data and AI are the amplifier. Business leads, technology enables. Reverse the order and you build impressive platforms with exactly zero effect on margin.
And now the asterisks
If I stopped here, this would be a LinkedIn post with a rocket emoji. But I am not stopping here, because the arithmetic comes with conditions, and I want to spell them out.
First: this is a target picture, not a forecast. The 5/5/10 describe what a company can achieve if it consistently realises its data and AI potential: best in class, not average after twelve months. Anyone promising that your margin will triple next year is selling you a magic trick.
Second: the percentages do not fall from the sky, they are earned, against investment. Data foundation, use case development, change, operations: all of that costs money before it makes any. An honest calculation sets the margin effect against the investment side, use case by use case. That is what “business case” means: not the prettiest slide, but the most defensible one.
Third: value only materialises in production, in daily operations. A pilot living in a demo folder saves exactly zero euros. You get the five per cent productivity only once the agent really checks documents, every day, with governance and traceability, and only if the people in the process let it. Adoption is not an afterthought; adoption is half the business case.
Fourth: time freed up is not yet a euro saved. Five per cent productivity only becomes margin once the freed capacity either carries revenue or replaces cost. Decide that up front, or you end the year with the same costs and a better feeling.
And fifth: your starting position is not the model calculation. Perhaps your biggest lever is not costs at all but pricing. Perhaps it is not ten per cent but six. The mechanics of the narrow rim still hold. You just have to work out your own numbers.
From number game to plan
So how do you find out what is sitting in your company? Another tool assessment helps very little, in my experience. What helps is a sober inventory: which decisions, processes and bottlenecks carry the biggest margin lever, and where can data and AI concretely go to work on them? Out of that comes a potential map, out of the map come prioritised use cases, out of the use cases a horizon plan spanning 12 to 18 months: quick wins first to prove value, then the capabilities that scale.
The entry point is deliberately small. A workshop that brings stakeholders to one table and maps the potential costs a day and not a cent of regret. Afterwards you know whether your version of the 5/5/10 reads 3/2/4 or 6/8/12. Either is a result. Either is more than most strategy papers deliver.
Back to the bakery
So does the right data and AI strategy triple your margin? Short answer: no — no piece of paper triples anything. Long answer: the arithmetic behind it is real, and it gets cashed in wherever three unremarkable levers are worked consistently and in production, instead of waiting for the one big move.
The bakery down the road did not perform magic. It has full shelves at four in the afternoon, less product in the bin, and a team that bakes instead of sorting notes. Three small numbers at the narrow rim.
The rest is multiplication.